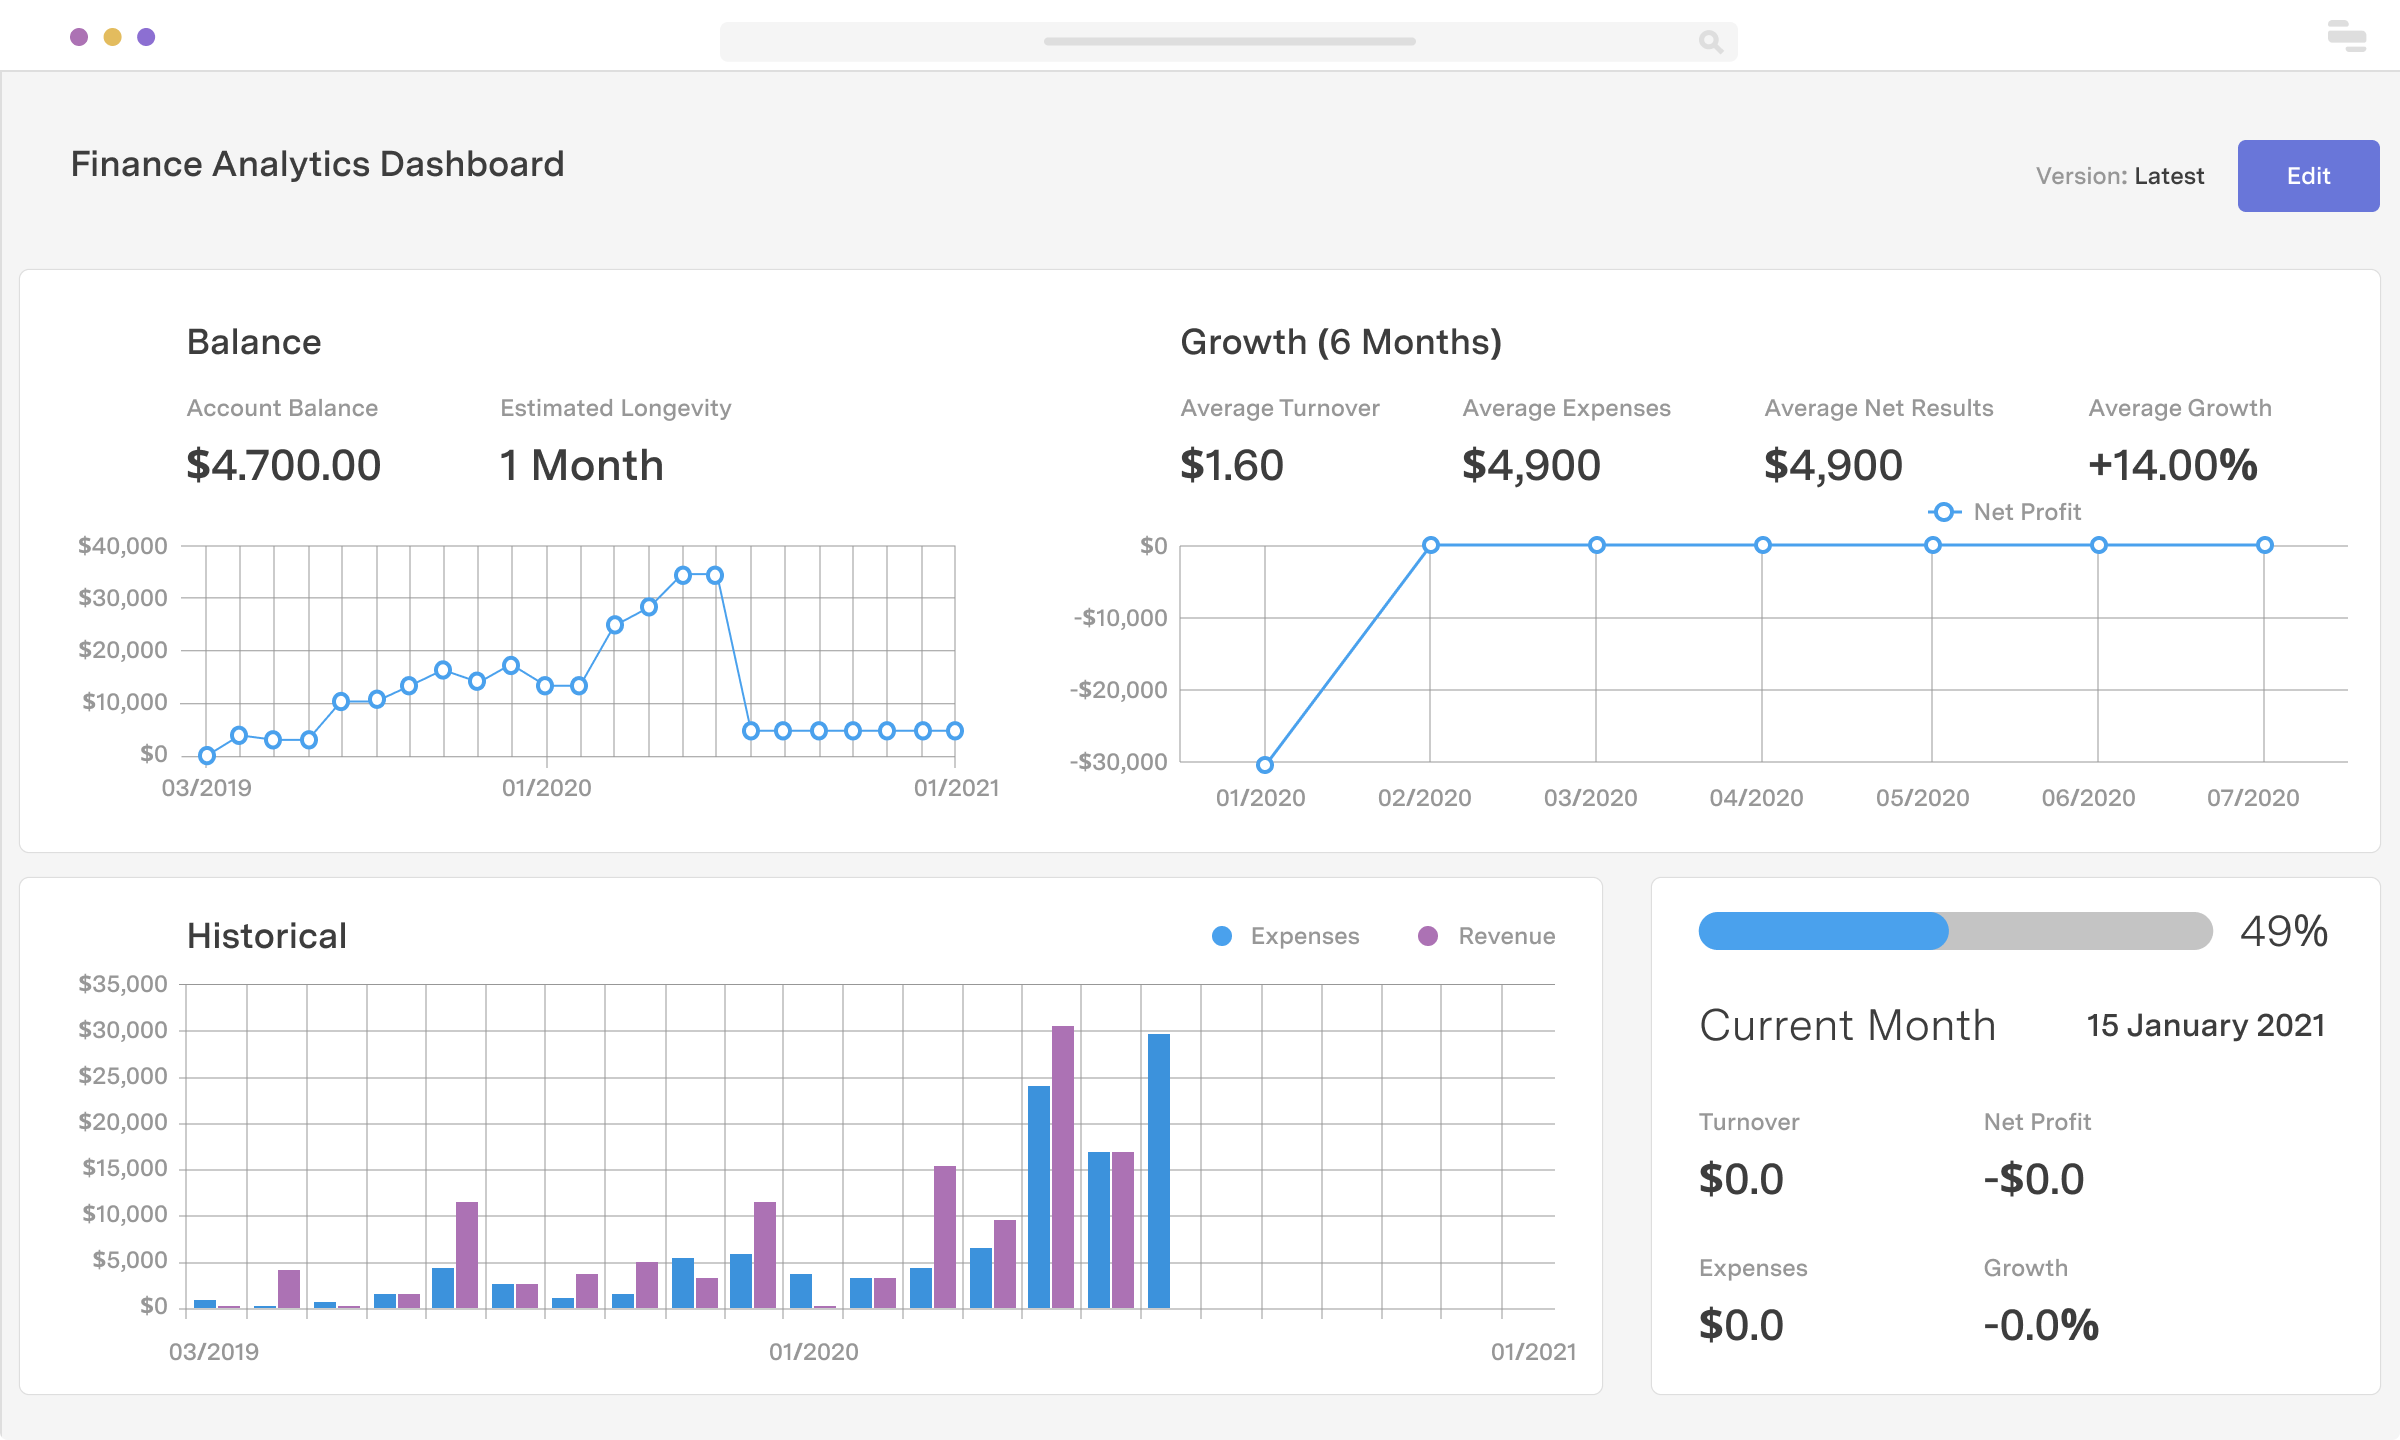
Startup runway dashboard
With Retool, you can build a financial dashboard for startups to track revenue and expenses, calculate cash burn, and project the runway of your business given financials. The example shown is taken from a real use case that reads Airtable data extracted from a bank account automatically with Zapier.
Industry
Financial Services•Software as a Service•Ecommerce•Startups•
End users
Operations•Analytics•
Components
Chart
Text
Progress Indicator
Components
Build from a handful of drag-and-drop components
Data source
The example shown above pulls in financial data from Airtable and Zapier. Retool connects with dozens of APIs and data sources out of the box. See all of our integrations here.
 1. Create resource
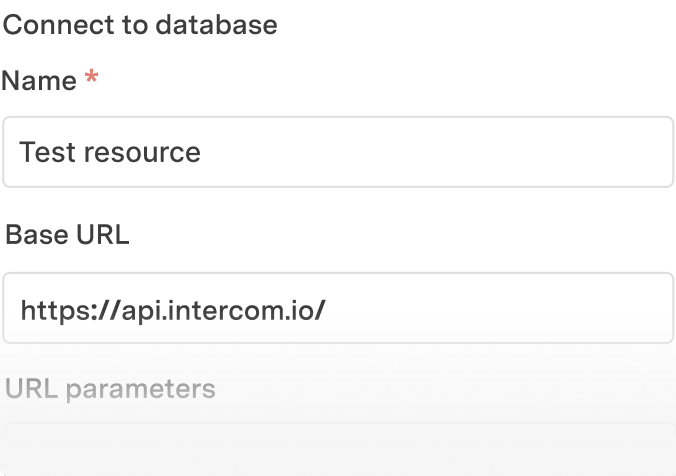 2. Read data
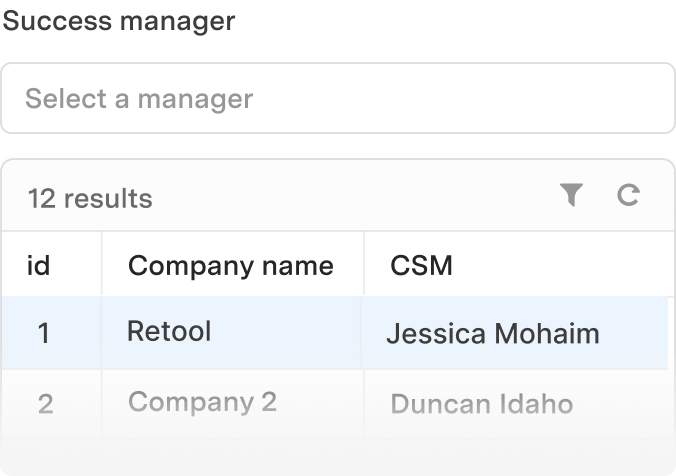
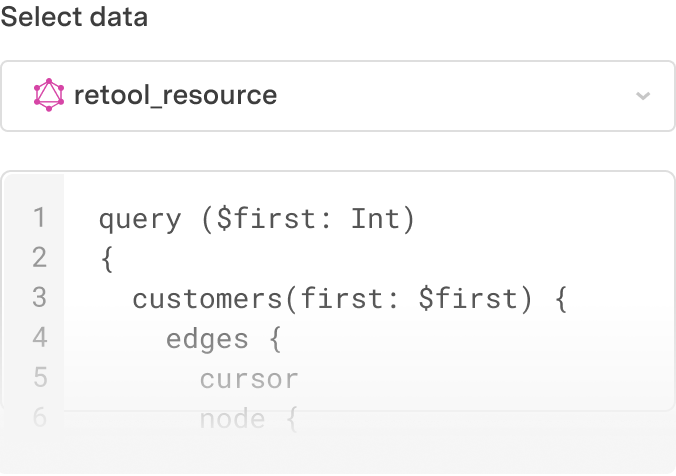 3. Connect data with UI
Related use cases
What you can build with Retool


Pedro Franceschi
Co-founder and CTO at Brex
Retool is incredible. It's been a critical for our ops from the start, and is the reason we’re able to scale so quickly. And the on-prem version with access controls & audit logs makes it easy to meet our compliance requirements.